Understanding and analyzing a company’s financial performance is crucial for making informed business decisions. By evaluating various financial metrics, such as gross profit margin, net profit margin, working capital, current ratio, quick ratio, leverage, return on equity, return on assets, inventory turnover, and operating cash flow, you can gain insights into the company’s profitability, liquidity, solvency, and operating efficiency. To conduct a comprehensive financial performance analysis, it is essential to review key documents like the balance sheet, income statement, cash flow statement, profit and loss statement, and general ledger. By monitoring and assessing these important metrics, you can effectively assess a company’s financial standing and make informed decisions to drive success.
Financial Performance Analysis
Financial performance analysis is an evaluation of a company’s financial standing, considering categories such as assets, equity, expenses, liabilities, revenue, and profitability. This analysis is crucial for investors, creditors, and other stakeholders as it provides valuable insights into a company’s financial health and its ability to generate sustainable returns.
To conduct a comprehensive financial performance analysis, there are several essential documents that need to be considered. These documents provide a detailed snapshot of the company’s financial position and performance. Let’s take a closer look at each of them:
Balance Sheet
The balance sheet is a statement that provides a snapshot of a company’s financial position at a specific point in time. It presents the company’s assets, liabilities, and shareholders’ equity. By analyzing the balance sheet, investors can gain insights into a company’s liquidity, solvency, and overall financial stability. Key elements of the balance sheet include current assets, fixed assets, current liabilities, long-term liabilities, and shareholders’ equity.
Income Statement
The income statement, also known as the profit and loss statement, provides information about a company’s revenues, expenses, gains, and losses over a specific period. It helps to measure the company’s profitability by calculating the net income or net loss. The income statement is essential for assessing a company’s ability to generate profits and manage expenses. Key components of the income statement include revenue, cost of goods sold, operating expenses, non-operating income, and taxes.
Cash Flow Statement
The cash flow statement tracks the flow of cash into and out of a company over a specific period. It provides information about a company’s operating activities, investing activities, and financing activities. By assessing the cash flow statement, investors can determine a company’s ability to generate cash and its ability to meet its financial obligations. Key sections of the cash flow statement include cash flows from operating activities, cash flows from investing activities, and cash flows from financing activities.
Profit and Loss Statement
The profit and loss statement, also known as the income statement, provides a summary of a company’s revenues, expenses, and resulting profits or losses over a specific period. It helps to measure the company’s profitability by calculating the net income or net loss. The profit and loss statement is essential for evaluating the company’s ability to generate profits and manage expenses effectively. Key components of the profit and loss statement include revenues, cost of goods sold, operating expenses, non-operating income, and taxes.
General Ledger
The general ledger is a primary financial accounting tool that contains all the accounts and transactions of a company. It serves as a complete record of financial transactions and is crucial for accurately preparing financial statements. The general ledger keeps track of each transaction’s debit and credit and provides detailed information about a company’s financial activities. By analyzing the general ledger, investors can gain insights into the company’s financial performance and identify any discrepancies or irregularities.
Now that we have explored the essential documents for financial performance analysis, let’s delve into the key financial performance metrics that should be monitored and assessed:
Gross Profit Margin
Gross profit margin is a measure of a company’s profitability after deducting the cost of goods sold (COGS) from its revenue. It indicates the percentage of revenue that remains as gross profit, which can be used to cover operating expenses and generate net profit. A higher gross profit margin signifies that a company is efficiently managing its production costs and pricing its products or services effectively. On the other hand, a lower gross profit margin may indicate inefficiencies or pricing challenges.

This image is property of www.financealliance.io.
Net Profit Margin
Net profit margin is a measure of a company’s profitability after deducting all expenses, including costs of goods sold, operating expenses, taxes, and interest, from its revenue. It indicates the percentage of revenue that remains as net profit, which is an essential metric for assessing a company’s overall financial health and efficiency. A higher net profit margin indicates that a company is generating more profit from every dollar of revenue, while a lower net profit margin may signify financial challenges or inefficiencies.
Working Capital
Working capital is a measure of a company’s ability to cover its short-term liabilities with its short-term assets. It represents the funds available to a company for its daily operations, such as paying suppliers, managing inventory, and meeting short-term obligations. To calculate working capital, subtract a company’s current liabilities from its current assets. Positive working capital indicates that a company has enough resources to meet its short-term obligations, while negative working capital may indicate financial difficulties or liquidity concerns.

This image is property of www.financealliance.io.
Current Ratio
The current ratio is a measure of a company’s short-term liquidity and ability to cover its current liabilities with its current assets. It is calculated by dividing a company’s current assets by its current liabilities. A current ratio of above 1 indicates that a company has more current assets than current liabilities, which signifies a strong liquidity position. However, a current ratio that is too high may suggest underutilized assets or inefficient capital allocation. On the other hand, a current ratio below 1 may indicate liquidity challenges or difficulties in meeting short-term obligations.
Quick Ratio
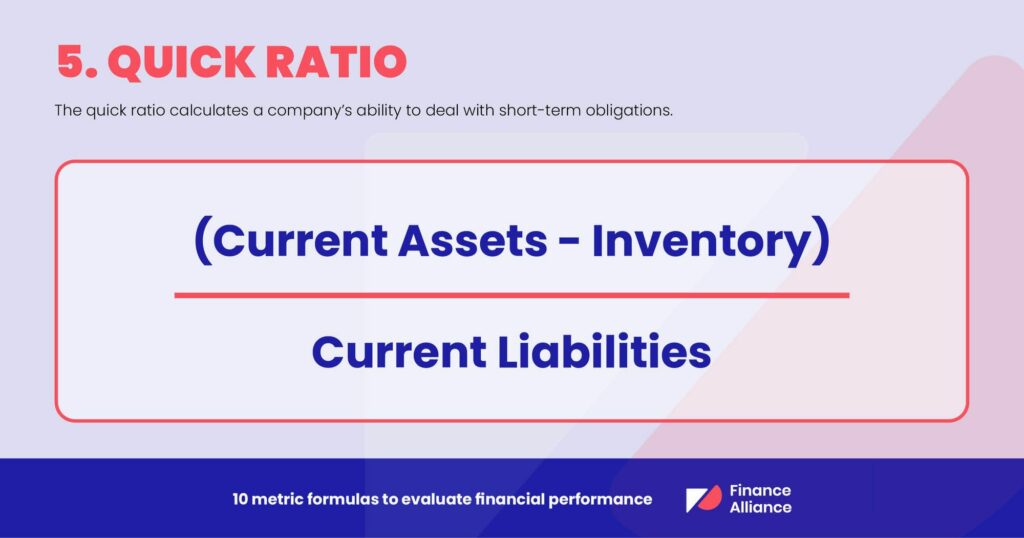
The quick ratio, also known as the acid-test ratio, is a more stringent measure of a company’s liquidity than the current ratio. It excludes inventory from current assets as it is not as easily convertible to cash as other current assets. The quick ratio is calculated by dividing a company’s current assets excluding inventory by its current liabilities. A quick ratio of above 1 indicates that a company has sufficient liquid assets to cover its short-term obligations, while a quick ratio below 1 may suggest liquidity challenges or difficulty meeting short-term liabilities.

This image is property of www.financealliance.io.
Leverage
Leverage, also known as the debt-to-equity ratio or financial leverage, measures the proportion of a company’s financing that comes from debt compared to equity. It indicates the degree of a company’s financial leverage and its reliance on borrowed funds to finance its operations. The leverage ratio is calculated by dividing a company’s total debt by its shareholders’ equity. A lower leverage ratio signifies a lower risk of financial distress and a healthier financial position. Conversely, a higher leverage ratio may indicate higher financial risk and the potential for difficulties in meeting debt obligations.
Return on Equity
Return on equity (ROE) is a measure of a company’s profitability and efficiency in generating returns for its shareholders. It indicates the percentage of net income returned as a profit to shareholders’ equity. ROE is calculated by dividing net income by shareholders’ equity and expressing it as a percentage. A higher ROE signifies that a company is effectively utilizing its shareholders’ investments and generating attractive returns. On the other hand, a lower ROE may indicate inefficiencies or challenges in generating profits relative to the amount of capital invested by shareholders.
In addition to these financial performance metrics, it is also essential to assess a company’s financial health in four key areas:

This image is property of www.financealliance.io.
Four Key Areas of Financial Health
Liquidity
Liquidity refers to a company’s ability to meet its short-term financial obligations. It is a measure of the company’s ability to convert its assets into cash quickly and efficiently. A company with strong liquidity will be able to meet its payment obligations promptly, thus maintaining a favorable financial position and reputation. Evaluating liquidity involves analyzing working capital, current ratio, quick ratio, and the ability to generate and manage cash flows effectively.
Solvency
Solvency refers to a company’s ability to meet its long-term financial obligations. It is a measure of the company’s ability to generate enough income to cover its expenses and repay its debts over an extended period. A solvent company has adequate assets to cover its long-term liabilities and can continue its operations without the risk of insolvency. Evaluating solvency involves analyzing debt levels, leverage ratios, and the ability to generate sustained profitability and positive cash flows.
Profitability
Profitability is a measure of a company’s ability to generate profits relative to its expenses, cost of goods sold, and investments. It indicates how effectively a company is utilizing its resources and generating returns for its stakeholders. Evaluating profitability involves analyzing gross profit margin, net profit margin, return on equity, return on assets, and other profitability ratios. A profitable company can generate sustainable returns and is likely to attract investors and maintain long-term growth.
Operating Efficiency
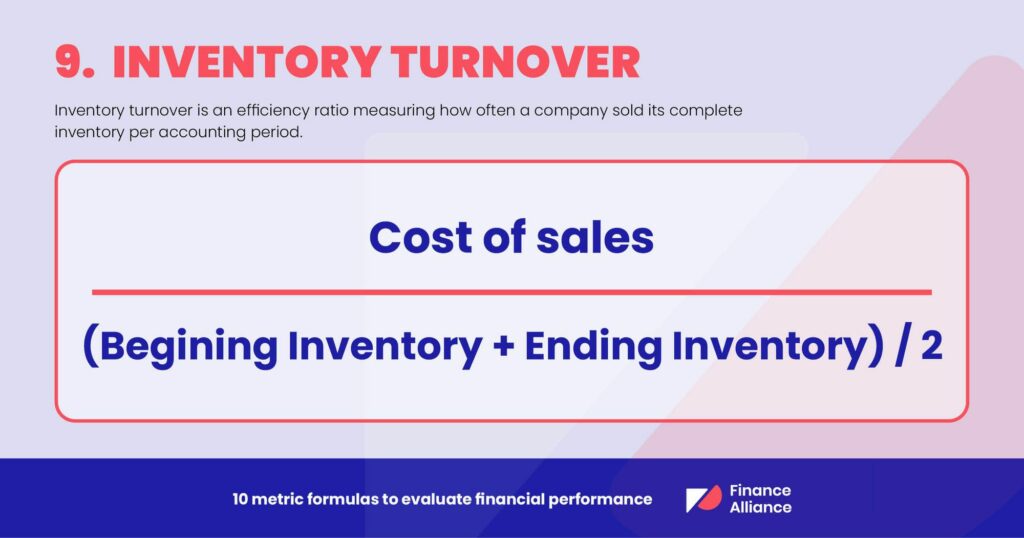
Operating efficiency refers to a company’s ability to utilize its resources effectively and generate maximum output from its inputs. It involves optimizing processes, minimizing waste, and reducing costs to improve profitability and productivity. Evaluating operating efficiency involves analyzing inventory turnover, accounts receivable turnover, accounts payable turnover, and other efficiency ratios. An efficient company can streamline its operations, enhance customer satisfaction, and gain a competitive advantage in the marketplace.
In conclusion, financial performance analysis is a critical process for assessing a company’s financial standing and performance. By analyzing essential documents such as the balance sheet, income statement, cash flow statement, profit and loss statement, and general ledger, investors can gain valuable insights into a company’s financial health and stability. Monitoring key financial performance metrics and evaluating areas of financial health, such as liquidity, solvency, profitability, and operating efficiency, can help investors make informed decisions and assess the overall financial viability of a company.
